

Same energy consumption. Same supplier. 39% price difference.
That’s what the data shows. A business in North Wales pays an average of £5,746 per year for energy. The same business in North East England pays £4,137. That’s a £1,609 gap - and most business owners have no idea it exists.
This data comes from POWWR’s Q4 2025 Energy Barometer, which analyses real contract data from across the UK B2B energy market. POWWR processes a significant portion of UK business energy transactions, so this isn’t survey data - it’s what businesses are actually paying.
And regional variation is just one layer. According to Ofgem’s State of the Market Report (opens in new tab) (January 2026), UK business electricity prices are 92% higher than the EU median - the highest in Europe. Before you even account for your postcode, you’re already paying nearly double what a German or French competitor pays.
All data in this article is current as of January 2026, drawing from Ofgem’s State of the Market Reports (Retail and Infrastructure) and POWWR’s Q4 2025 Energy Barometer. Regional charges and infrastructure costs are subject to annual review.
TL;DR: Key Takeaways
The Gap: Business energy costs vary by up to 39% depending on your region - that’s £1,609 per year between the most and least expensive areas.
The Cause: Three layers of regional charges - Distribution Network Operator (DNO) costs, Transmission Network Use of System (TNUoS) charges, and Grid Supply Point (GSP) pricing zones.
Getting Worse: TNUoS charges are rising 5-15% in 2026, hitting South Wales, South West, and South East hardest. Non-commodity charges now make up nearly 60% of business bills.
What You Can Do: Know your DNO region, audit your contract for pass-through clauses, benchmark against regional averages, and consider timing your renewal strategically.
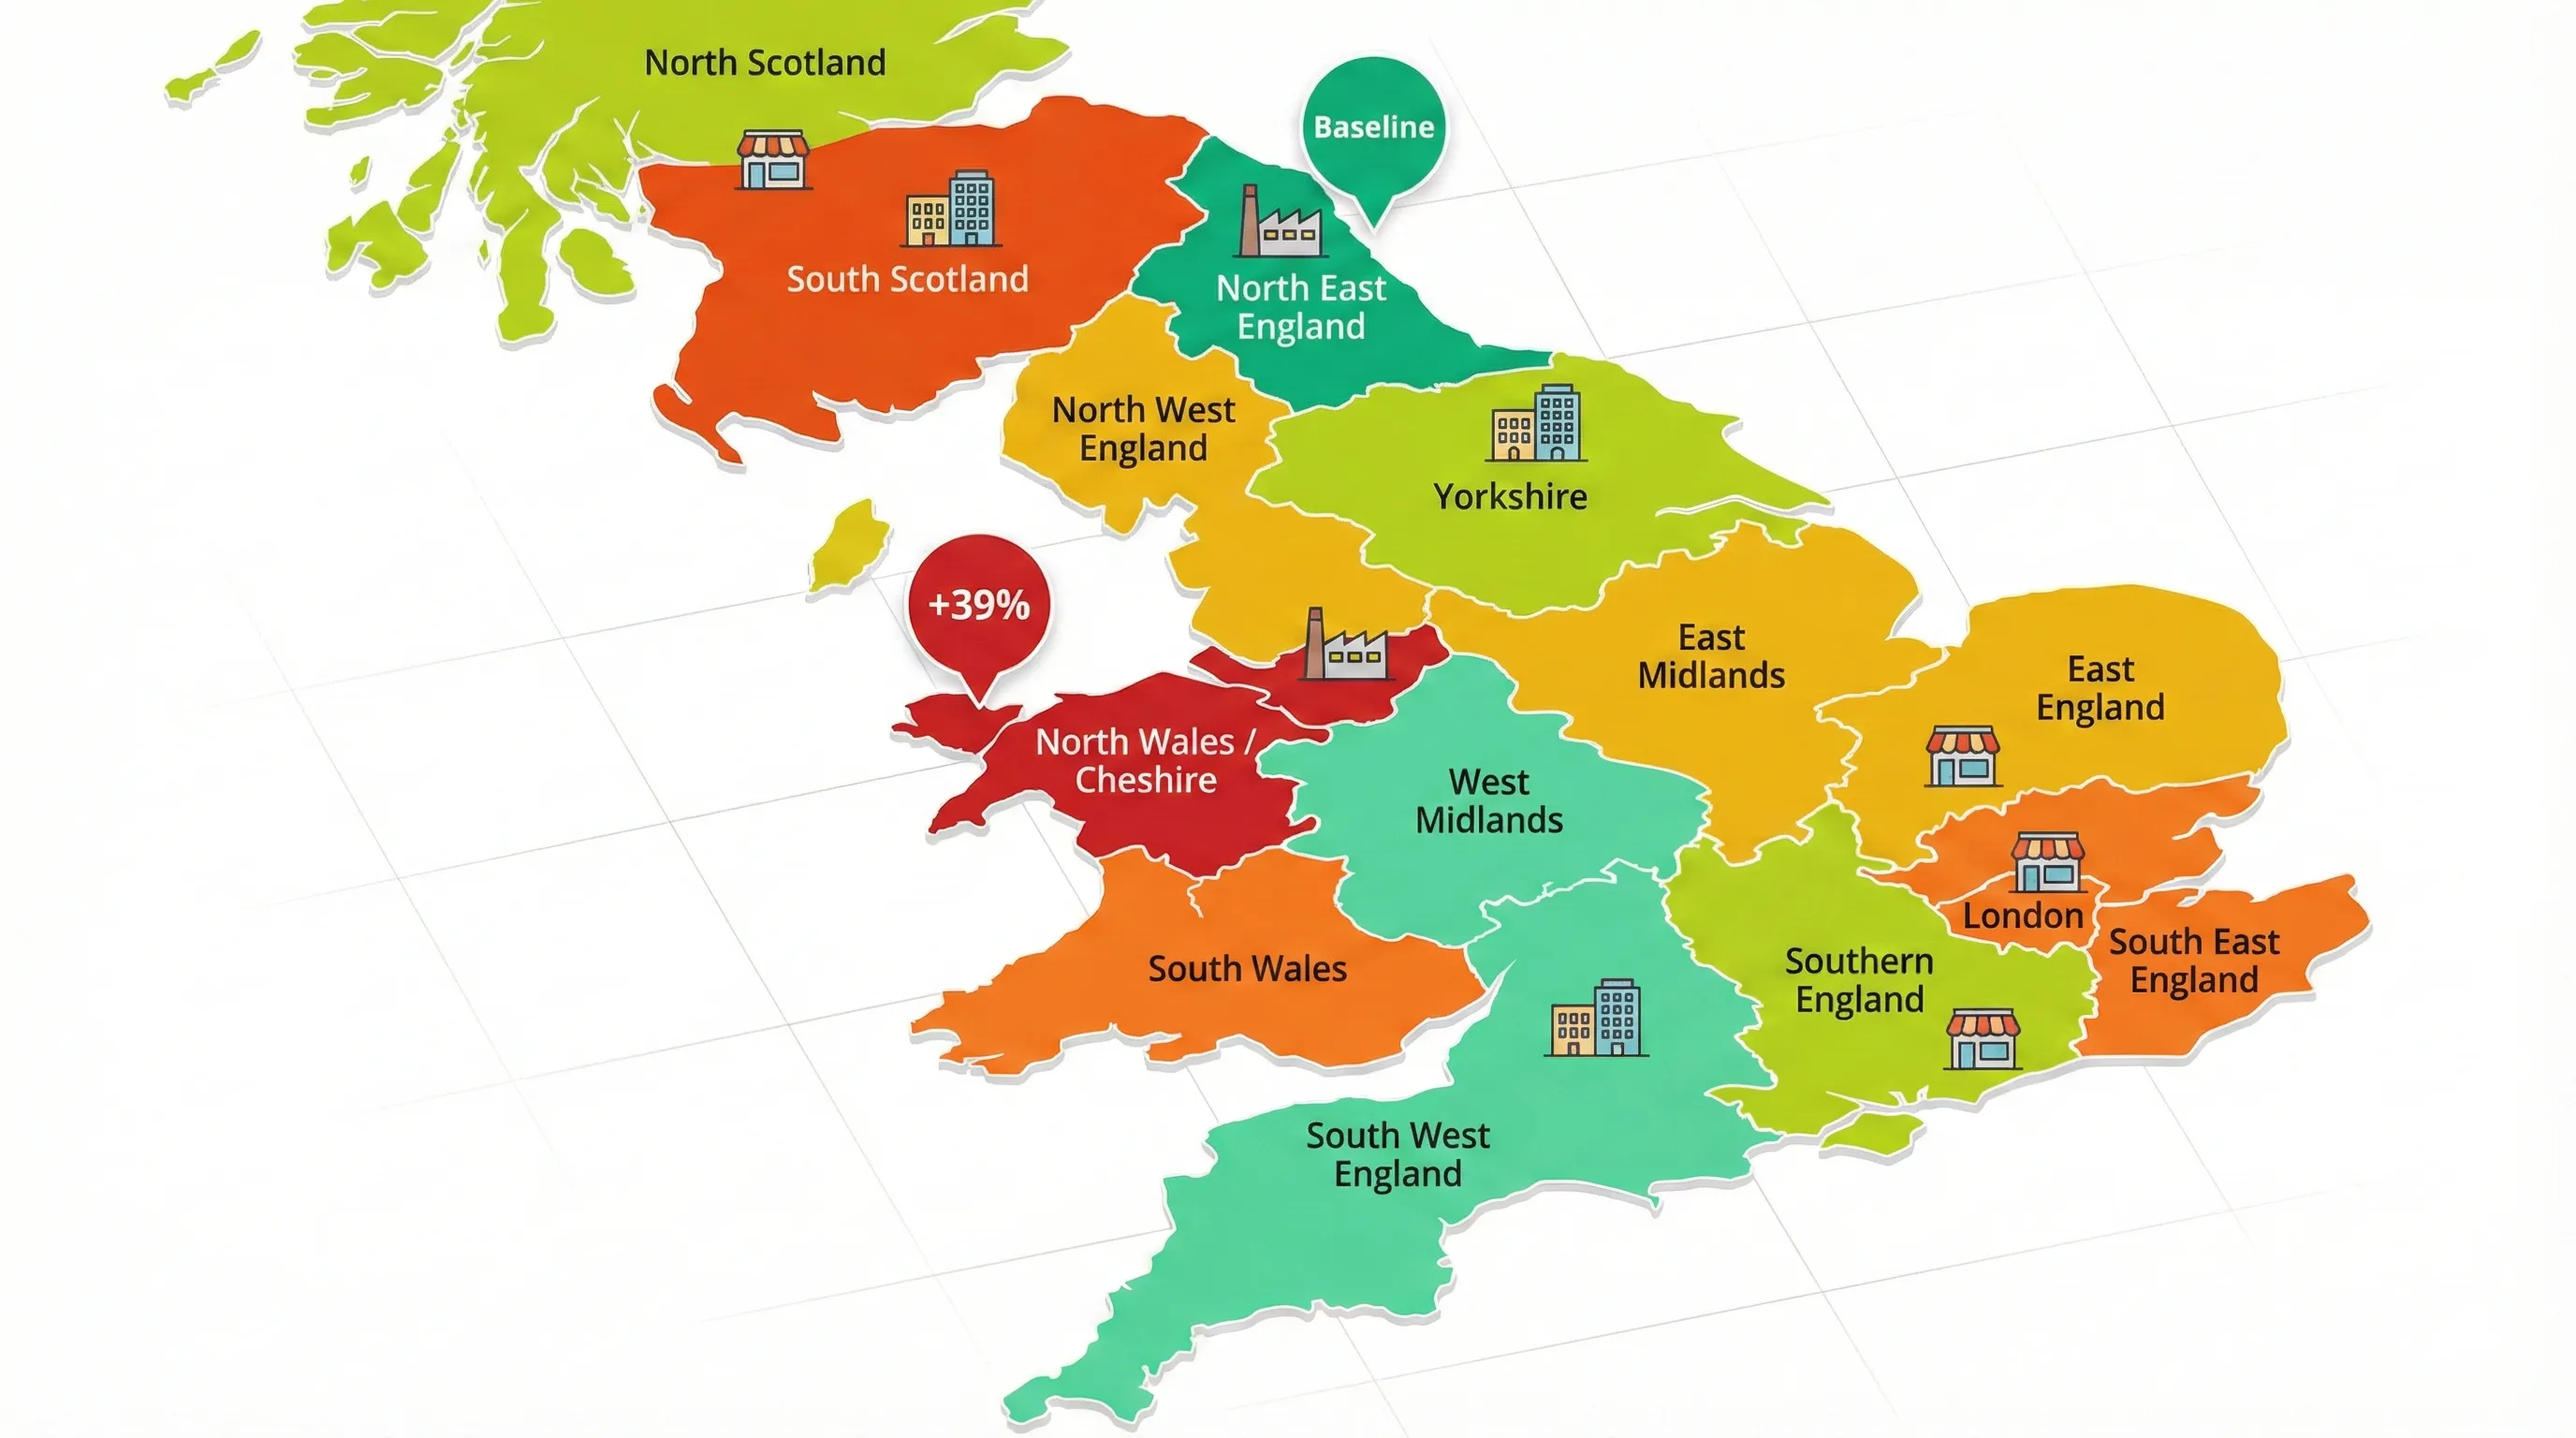
The Regional Price Map
Here’s what UK businesses are actually paying by region, ranked from most to least expensive:
| Region | Average Annual Cost | vs Cheapest Region |
|---|---|---|
| North Wales / Cheshire | £5,746 | +39% |
| South Scotland | £5,660 | +37% |
| London | £5,067 | +22% |
| South East England | £4,884 | +18% |
| South Wales | £4,735 | +14% |
| East England | £4,701 | +14% |
| East Midlands | £4,688 | +13% |
| North West England | £4,673 | +13% |
| Southern England | £4,663 | +13% |
| Yorkshire | £4,624 | +12% |
| North Scotland | £4,596 | +11% |
| South West England | £4,494 | +9% |
| West Midlands | £4,268 | +3% |
| North East England | £4,137 | Baseline |
Source: POWWR Energy Barometer Q4 2025
The spread is striking. If you’re running a business in North Wales, you’re paying 39% more than an identical business in Newcastle - for the same energy.
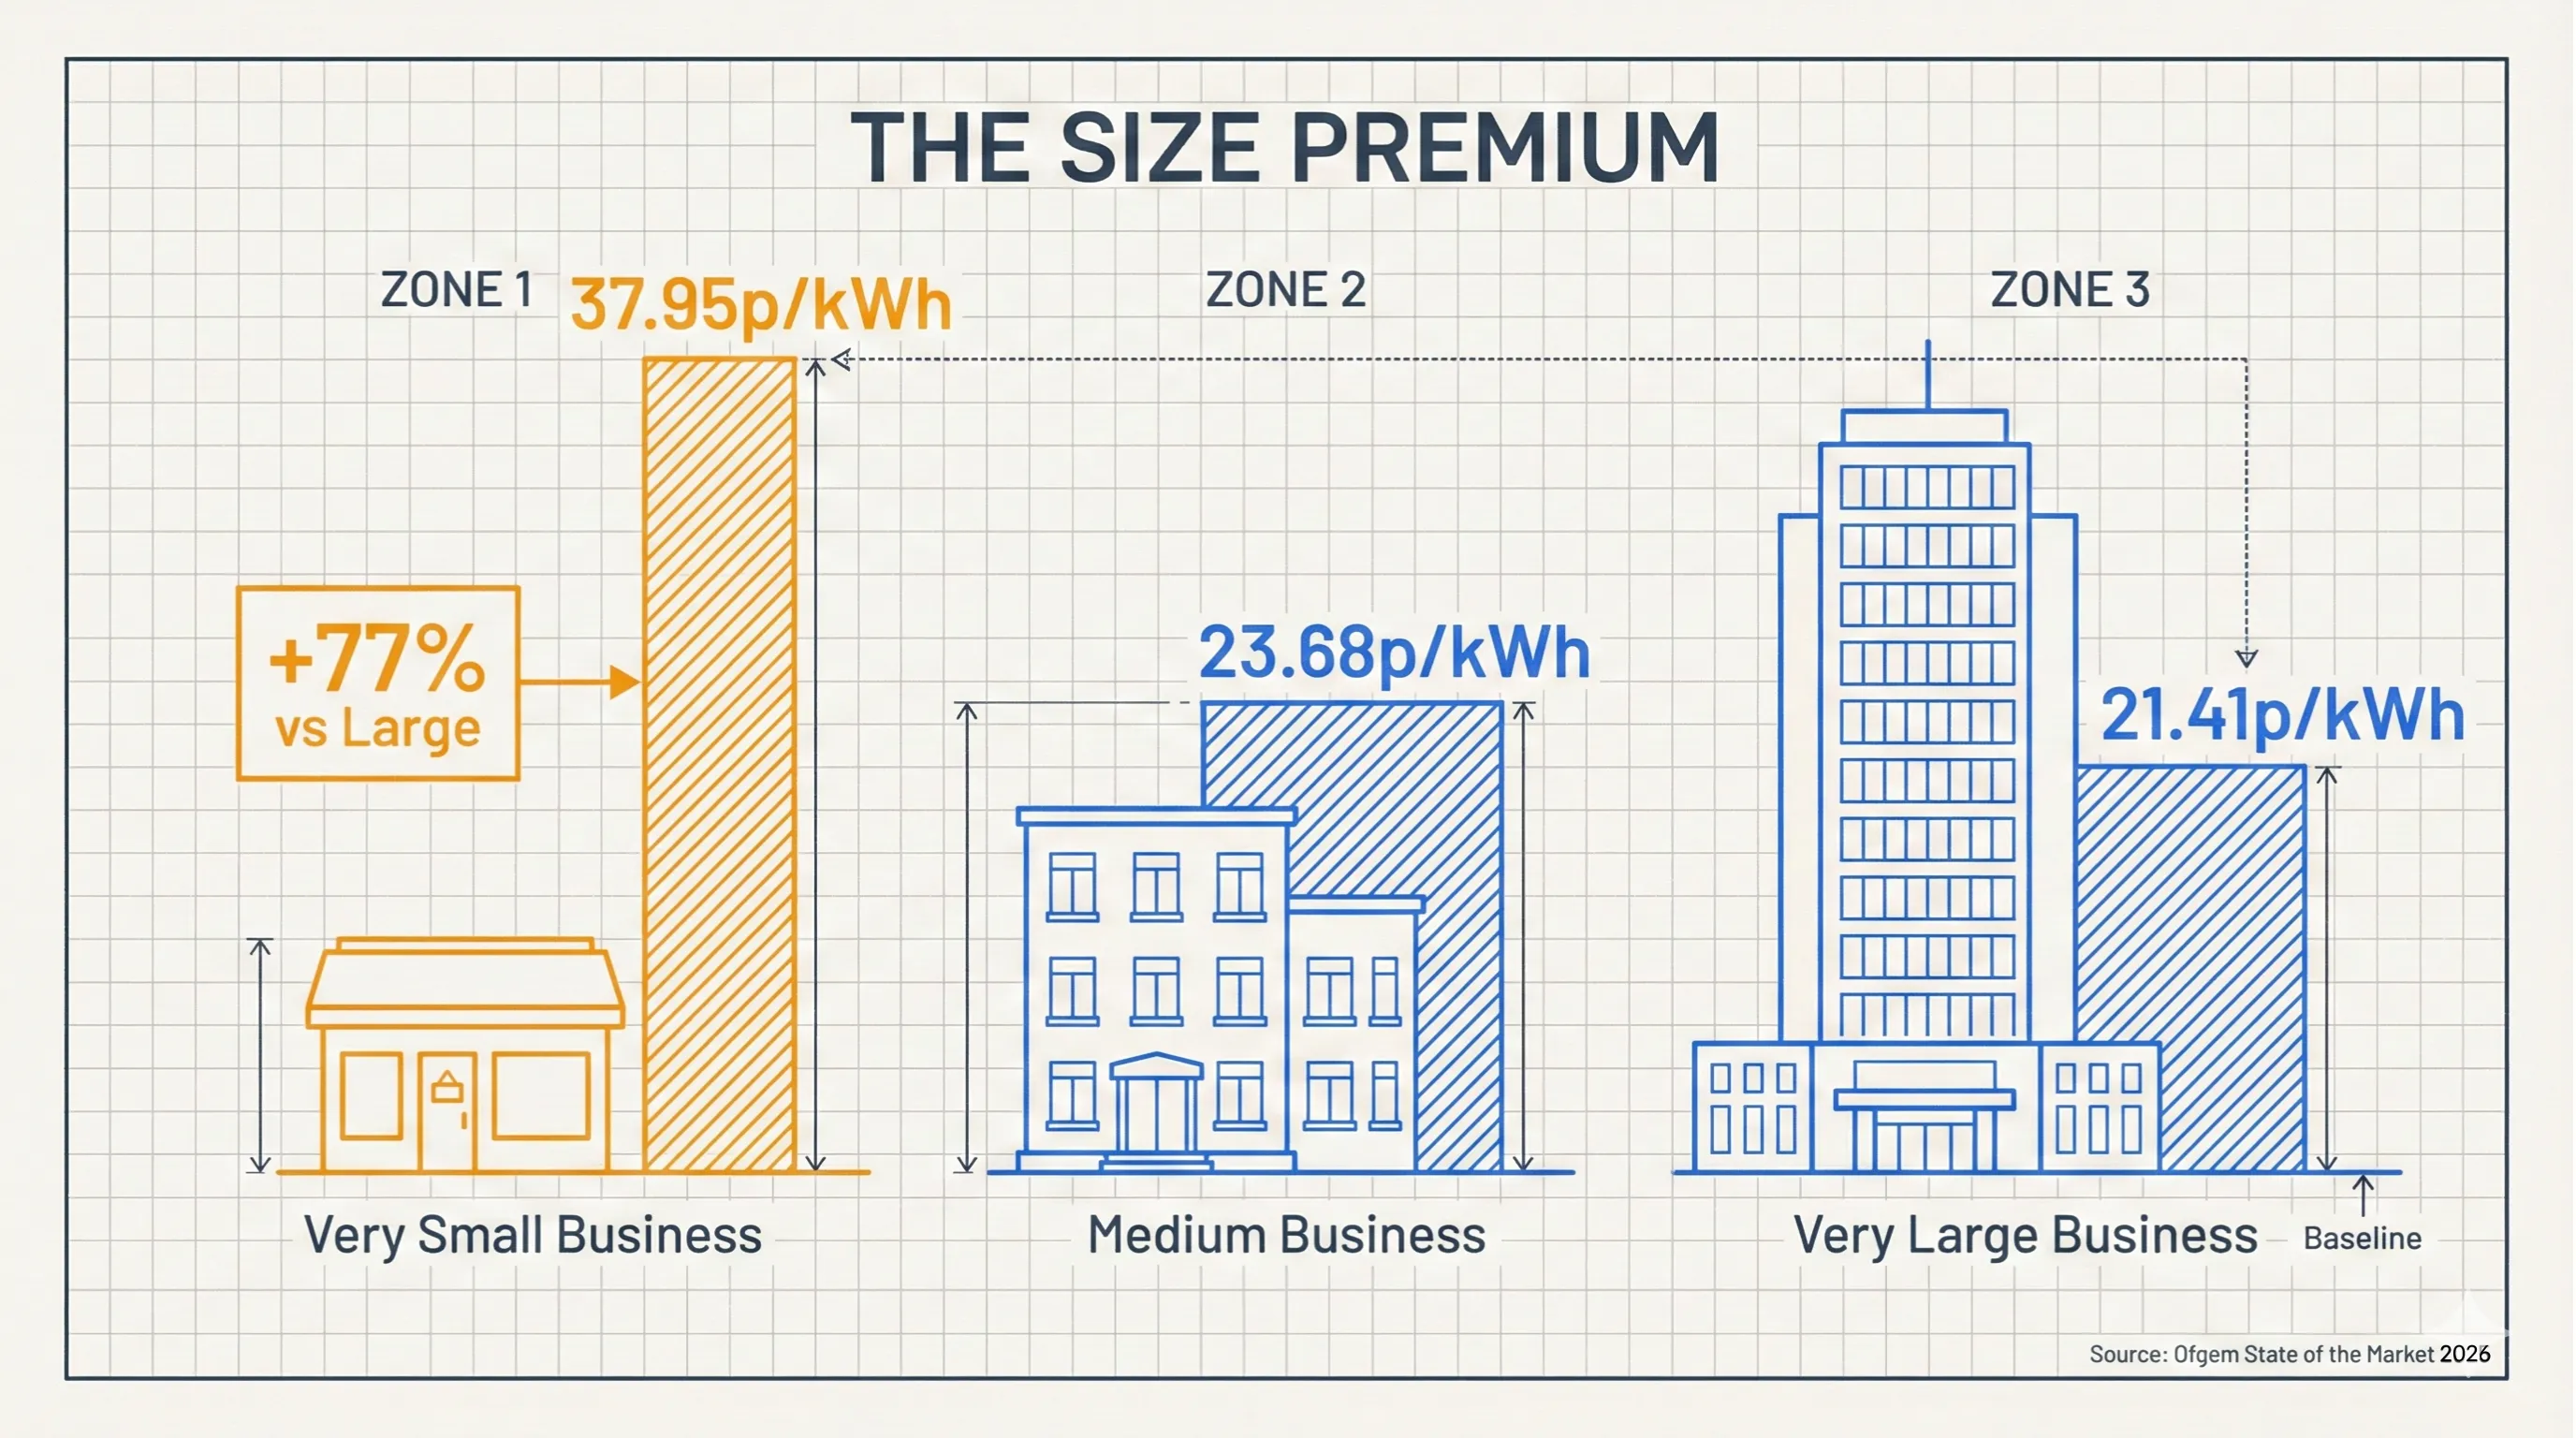
The Size Premium: Smaller Businesses Pay More
Regional variation isn’t the only factor working against you. Ofgem’s State of the Market data (opens in new tab) shows that business size also drives significant price differences:
| Business Size | Electricity (p/kWh) | Gas (p/kWh) |
|---|---|---|
| Very Small | 37.95p | 8.72p |
| Medium | 23.68p | 4.93p |
| Very Large | 21.41p | 4.27p |
Source: Ofgem State of the Market Report, Q2 2025 data
Very small businesses pay 77% more per kWh for electricity than very large businesses. Combined with regional variation, a small business in North Wales faces a double penalty - the worst of both worlds.
Ofgem attributes this to “higher credit risk and shorter-term contracts” for smaller businesses. In practice, it means the businesses least able to absorb high energy costs are the ones paying the most. This size premium is compounded when brokers charge SMEs higher commissions than larger businesses.
Why Does This Happen?
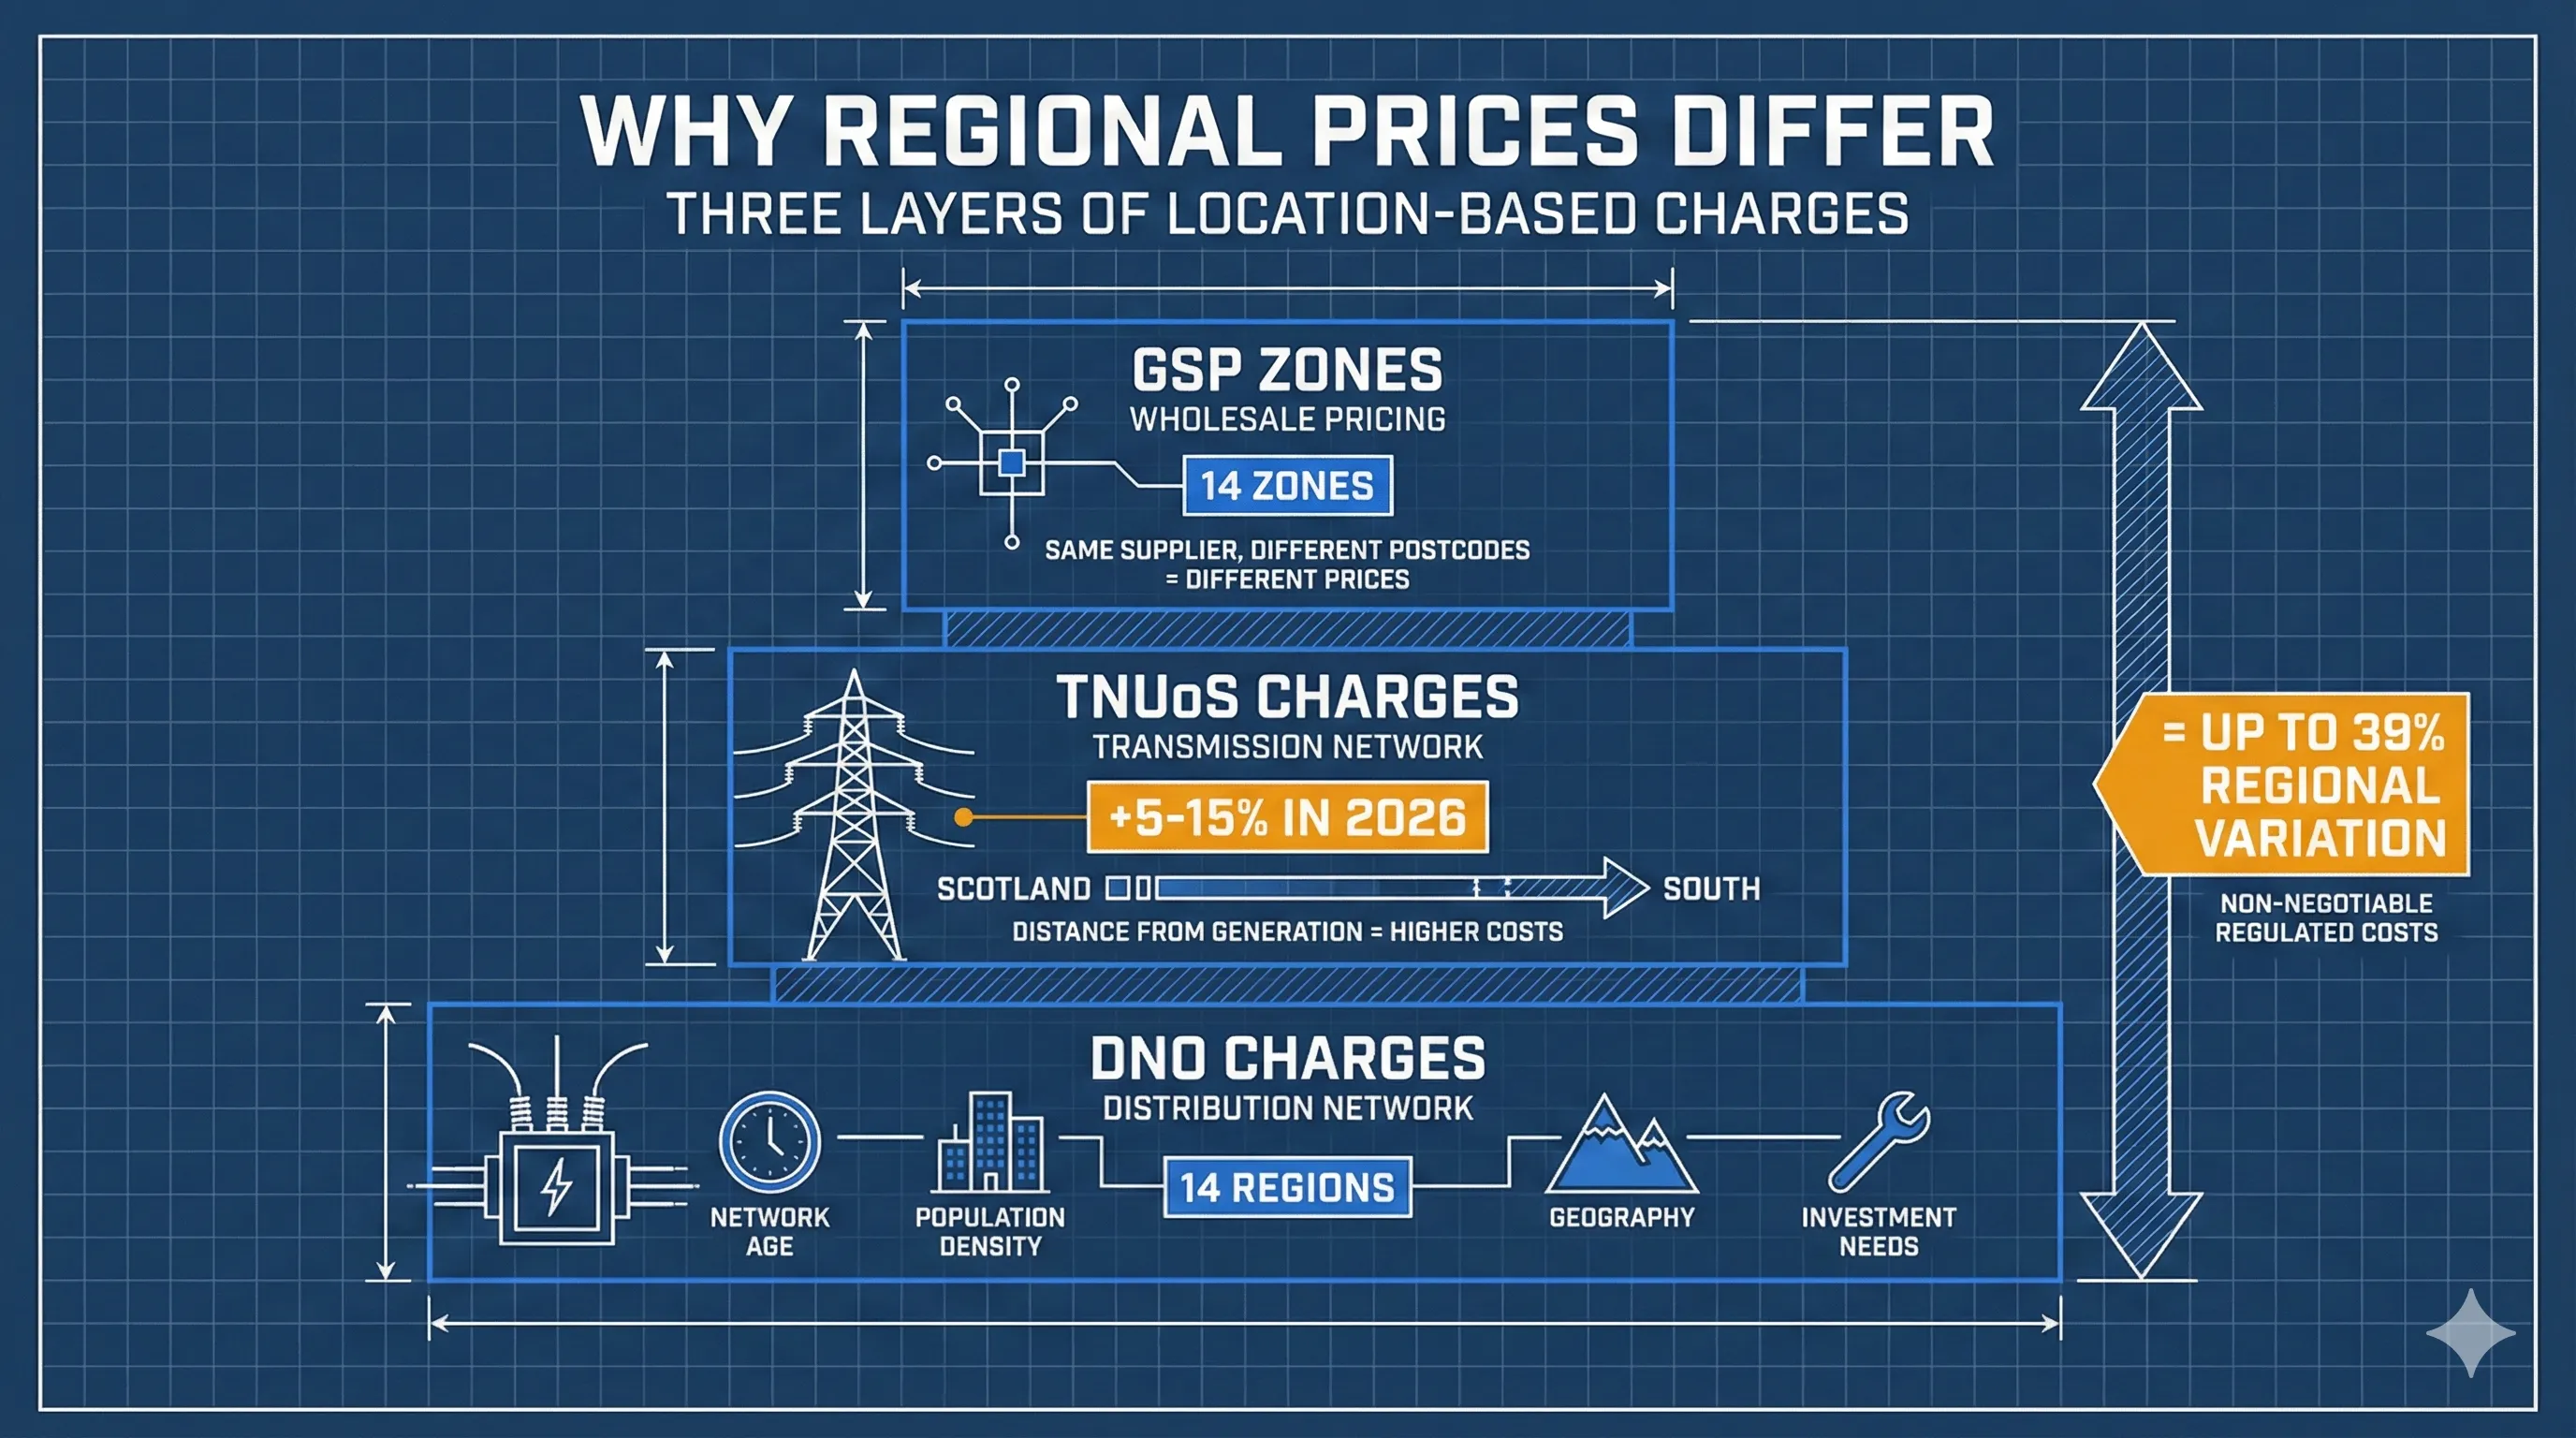
Your energy bill isn’t just one charge. It’s built from multiple components, and several of them vary by location.
1. Distribution Network Operator (DNO) Charges
The UK is divided into 14 DNO regions. Each DNO owns and maintains the local electricity distribution network - the cables, substations, and infrastructure that deliver power to your premises.
Each DNO has different costs based on:
- Network age - Older infrastructure needs more maintenance
- Population density - Rural areas have longer cable runs per customer
- Geography - Challenging terrain increases installation and repair costs
- Investment needs - Some networks need more upgrading than others
These costs get passed through to your bill as distribution charges. There’s nothing you or your supplier can negotiate - each DNO sets their own tariffs within Ofgem’s RIIO regulatory framework (opens in new tab), but the individual charges are determined by the DNOs themselves based on their specific network costs.
2. Transmission Network Use of System (TNUoS)
TNUoS charges cover the cost of the high-voltage transmission network - the national grid that moves electricity from power stations to local distribution networks.
The key factor here is distance from generation. Electricity generated in Scotland needs to travel further to reach businesses in the South West than businesses in Yorkshire. That transmission costs money, and it gets charged based on location.
According to World Kinect (opens in new tab), TNUoS charges are rising 5-15% in 2026, with the steepest increases hitting:
- South Wales
- South West England
- South East England
These regions are furthest from the UK’s main generation hubs in Scotland and the North.
3. Grid Supply Points (GSPs)
The transmission network connects to local distribution networks at Grid Supply Points - 14 zones that determine wholesale pricing for your area. When suppliers price your contract, they’re using GSP-specific costs.
This is why “the same supplier” can quote different rates for identical usage in different postcodes. They’re not being arbitrary - they’re reflecting genuine cost differences in how energy reaches you.
How granular does this get? When suppliers send price books to energy brokers, they contain separate prices for every single GSP combined with different meter profile classes. A single supplier’s price book can have 10,000+ rows to account for all the combinations: different GSPs, different meter profiles, different day/night/weekend rates. Regional pricing isn’t an approximation - it’s baked into every quote at a granular level.
The Standing Charge Trap
Regional variation doesn’t just affect your unit rate. Standing charges - the daily fixed fee you pay regardless of consumption - also vary significantly by region.
Unlike domestic customers who have some protection through Ofgem’s price cap, business energy has no regulatory cap on standing charges. This means suppliers and brokers have more freedom to set (and inflate) these fixed daily fees.
Based on DNO charging data across different regions, business standing charges can range from:
- London and urban areas: Lower fixed charges due to dense infrastructure
- North Wales, Scotland, and rural areas: Significantly higher charges due to longer cable runs and sparser networks
We’ve covered business electricity standing charges in detail - including the 14 DNO regions and how charges vary. The regional gap in standing charges alone can add significant costs (depending on your business size and meter type) before you’ve used a single kWh.
Note on billing: Some suppliers bundle DUoS and TNUoS into a single “standing charge” line on your bill. Others break these out as separate line items. This makes comparing bills tricky - a supplier showing a “low standing charge” may simply be listing network charges separately elsewhere on the invoice. Always compare total fixed daily costs, not just the line labelled “standing charge.”
For low-usage businesses - small offices, part-time premises, seasonal operations - standing charges can represent a disproportionate chunk of the bill. A business using 5,000 kWh per year in North Wales loses relatively more to standing charges than one using 50,000 kWh.
Surprising Discoveries
London Isn’t the Most Expensive
Despite being the UK’s highest-cost city for almost everything else, London’s business energy prices are middle-of-the-pack at £5,067 per year - 22% above baseline but well below North Wales or South Scotland.
Why? Dense infrastructure. When you have millions of businesses packed into a small area, the cost per customer of maintaining the network drops. London’s DNO can spread fixed costs across more customers than rural Wales.
Scotland Is Split
North Scotland and South Scotland have dramatically different costs:
- North Scotland: £4,596/year (11% above baseline)
- South Scotland: £5,660/year (37% above baseline)
The difference? Proximity to generation. North Scotland is close to wind farms and the Scottish transmission network. South Scotland sits in a transition zone that doesn’t benefit as much from local generation but still faces Scottish DNO charges.
The North East Advantage
North East England has the UK’s lowest business energy costs at £4,137 per year. This region benefits from:
- Industrial infrastructure already in place from decades of heavy industry
- Proximity to North Sea gas and offshore wind connections
- Relatively modern distribution network following investment programmes
- Shorter transmission distances from northern generation
The Real-World Impact
According to Ofgem’s 2025 non-domestic research, most businesses are managing - but not comfortably:
- 70% keeping up with energy bills without difficulty
- 19% keeping up but struggling from time to time
- 6% in constant struggle with energy costs
Sole traders and micro-businesses are “more likely to struggle” than larger firms - which compounds the size premium we discussed earlier. The businesses paying the highest rates per kWh are also the ones least able to absorb those costs.
What’s Changing in 2026
TNUoS Increases Hit Southern Regions
Cornwall Insight (opens in new tab) forecasts that non-commodity charges will continue rising through 2026. TNUoS specifically is increasing 5-15% in southern regions as transmission costs rise and more renewable generation comes online in Scotland.
If you’re in South Wales, South West, or South East England, expect your bills to rise even if wholesale energy prices stay flat.
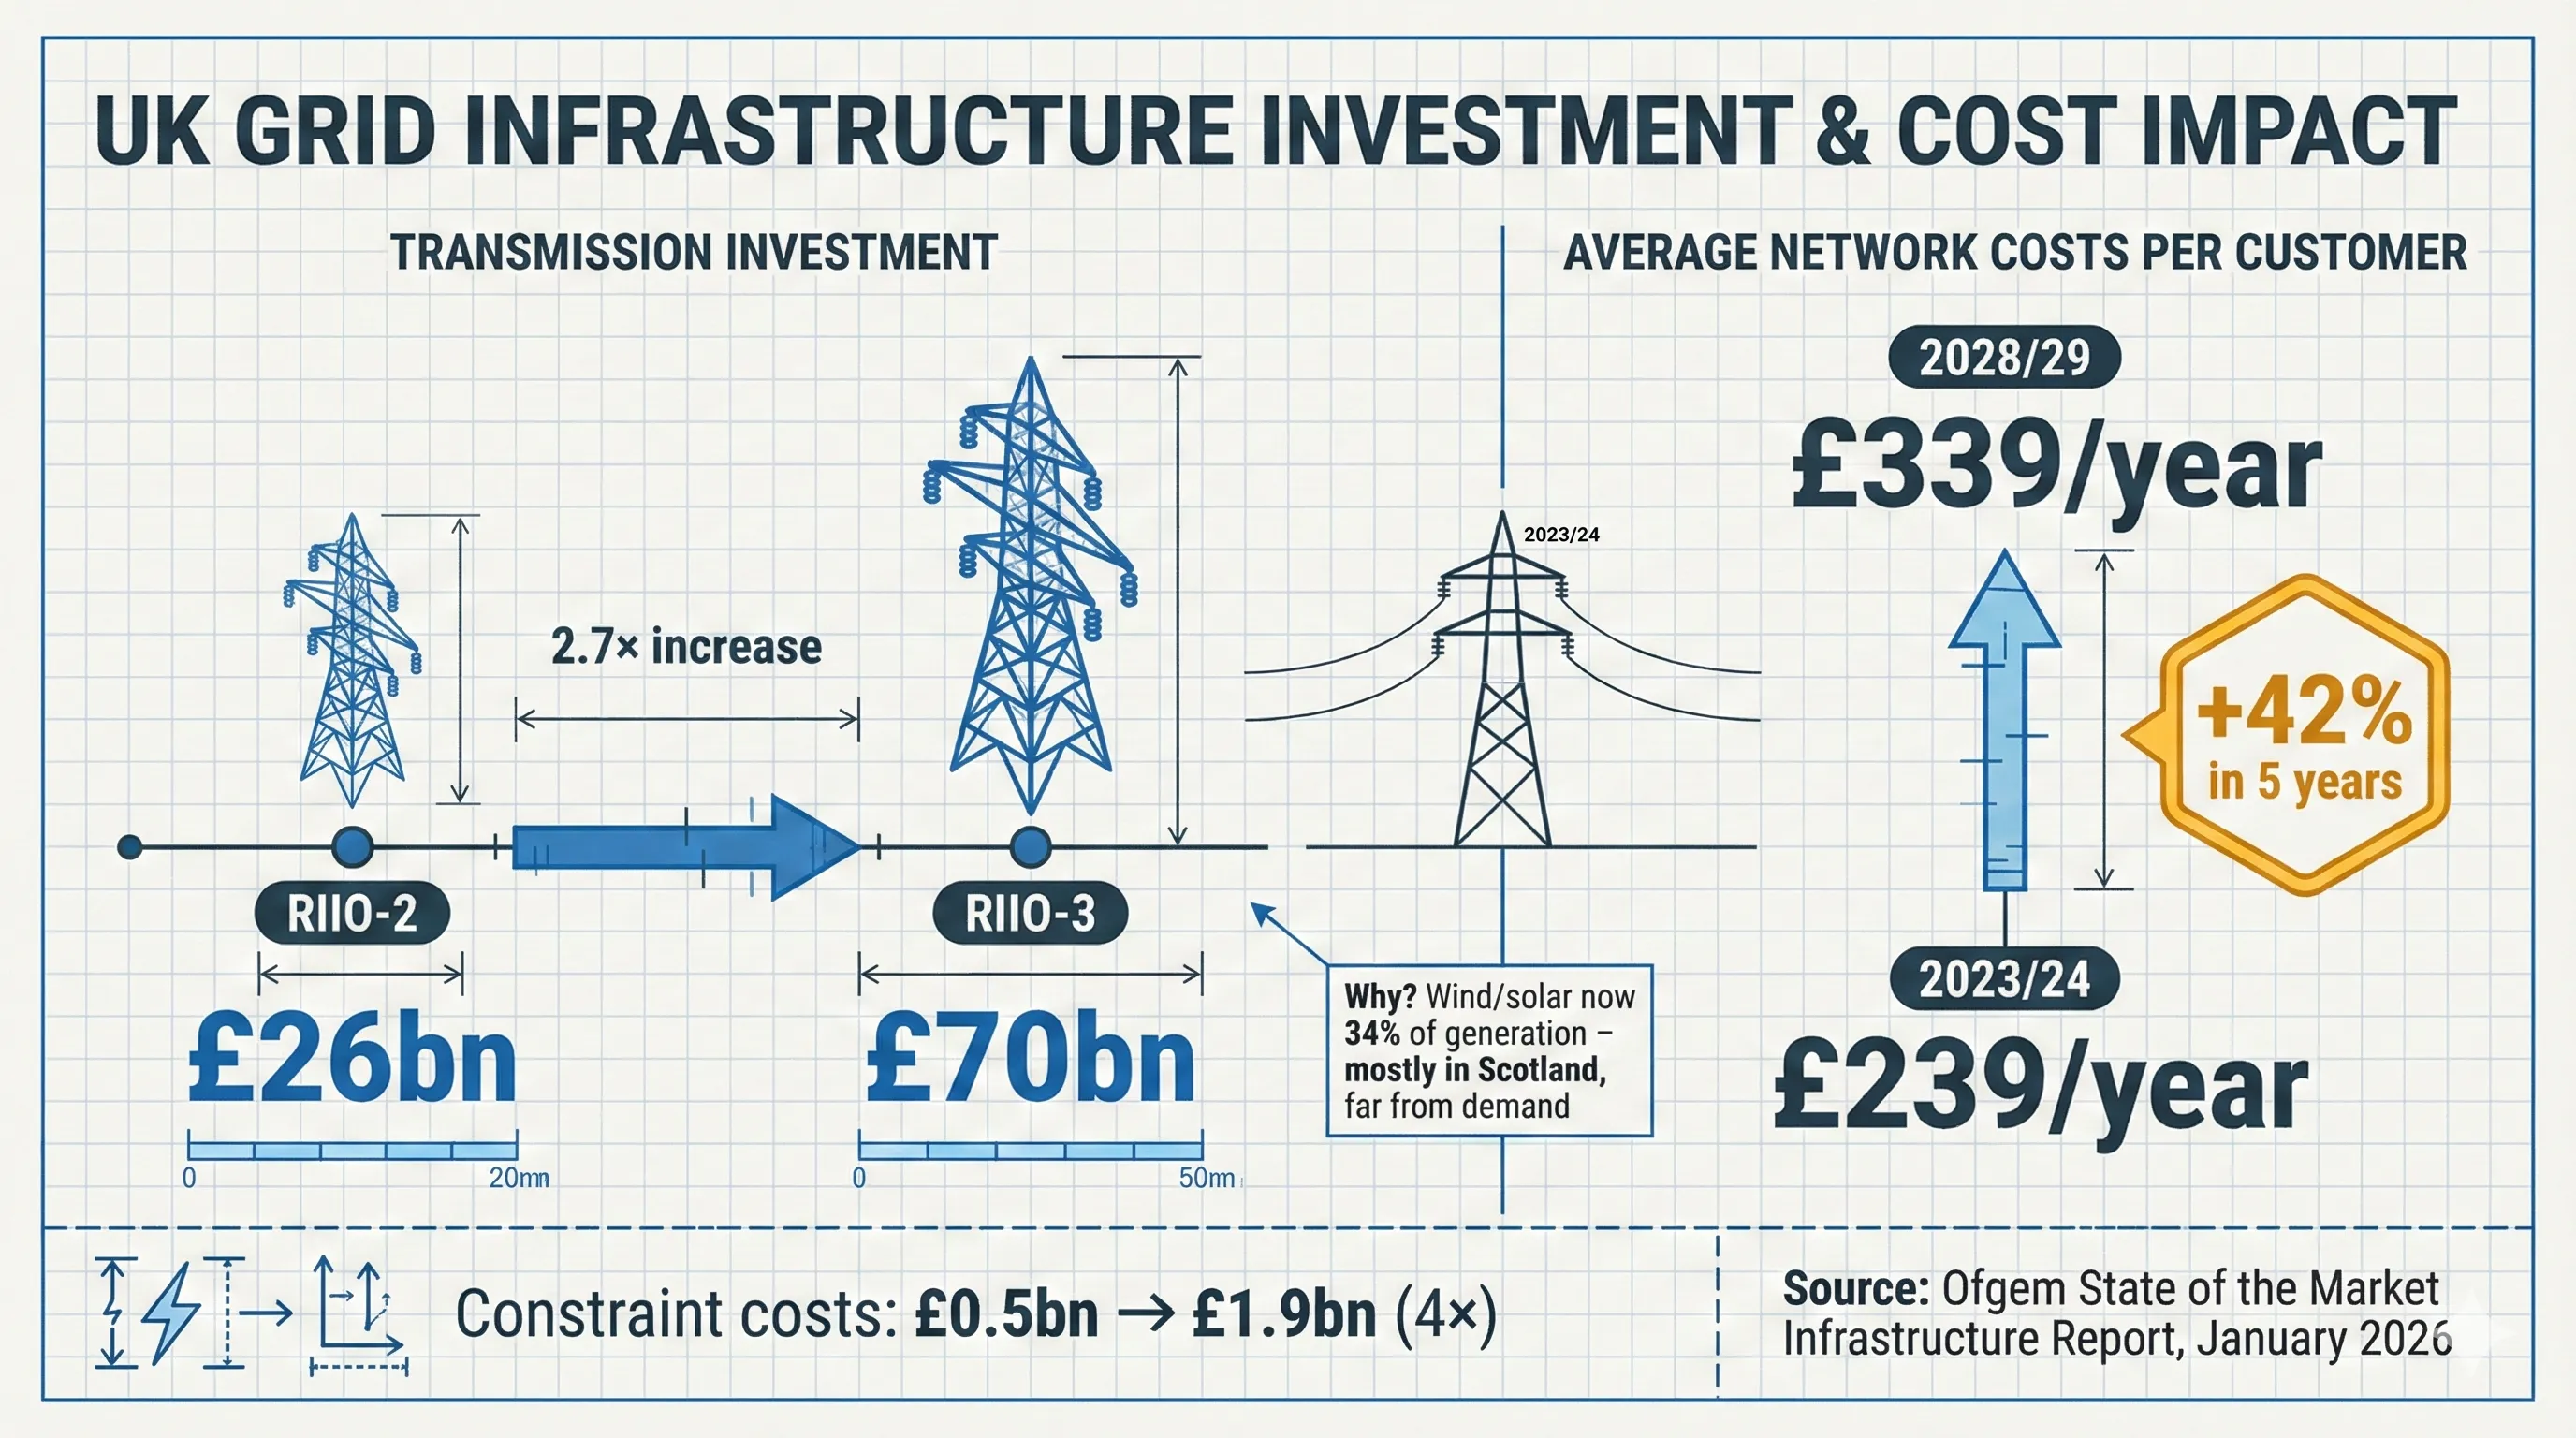
Infrastructure Investment: Why Network Costs Keep Rising
The numbers behind regional price increases tell the story. From Ofgem’s State of the Market Infrastructure Report (opens in new tab) (January 2026):
Network costs are rising 42% over 5 years - Average annual network costs per customer: £239 in 2023/24 → £339 by 2028/29.
£70bn transmission investment coming - RIIO-3 will see nearly £70bn invested in transmission infrastructure - almost triple the £26bn spent in RIIO-2.
Wind and solar now generate 34% of UK electricity - Most of this capacity is in Scotland, far from where demand is highest.
Constraint costs have quadrupled - The cost of managing grid constraints rose from £0.5bn to £1.9bn as wind farms generate power in Scotland while demand sits in England.
Generation and demand are in different places - This mismatch is the fundamental driver of rising transmission costs. Until new transmission links are built, businesses in the South will continue paying to move northern electricity south.
These aren’t temporary factors. The investment is needed, and the costs will flow through to business energy bills via TNUoS charges - which vary by region.
Non-Commodity Charges Now Dominate
Here’s the uncomfortable truth: wholesale energy now represents only 37% of your energy bill. Ofgem’s January 2026 State of the Market Report breaks down a typical bill:
| Component | % of Bill |
|---|---|
| Wholesale costs | 37% |
| Network costs (DNO/TNUoS) | 23% |
| Policy costs (levies, obligations) | 15% |
| Operating costs | 13% |
| Other costs | 9% |
| Debt-related costs | 3% |
Source: Ofgem State of the Market Report (opens in new tab), January 2026
That means 63% of your bill is non-commodity charges - costs that don’t fall when wholesale prices drop. A 2026 CBI and Energy UK report (opens in new tab) using British Gas data found a similar split for small businesses: just 38% wholesale, with 27% network costs, 19% policy costs, and the rest in operating costs and taxes. The network costs (23% in Ofgem’s breakdown, 27% in the CBI’s) are the regional charges we’ve been discussing - set by individual DNOs and National Grid within Ofgem’s regulatory framework, and varying significantly by location.
When wholesale prices fall, your bill doesn’t fall proportionally. These fixed and semi-fixed charges keep a floor under your costs - and they vary by region.
Market-Wide Half Hourly Settlement (MHHS)
Rolling out through 2026, MHHS (opens in new tab) will enable more granular pricing based on when you use energy, not just how much. We’ve written about how MHHS affects volume tolerance and billing - it creates both risks and opportunities depending on your consumption pattern. With 64% of business meters now smart or advanced (2 million meters), most businesses already have the infrastructure to benefit.
This creates both risk and opportunity:
- Risk: Peak-time usage will cost more
- Opportunity: Flexible businesses could shift consumption to cheaper periods, partially offsetting regional premiums
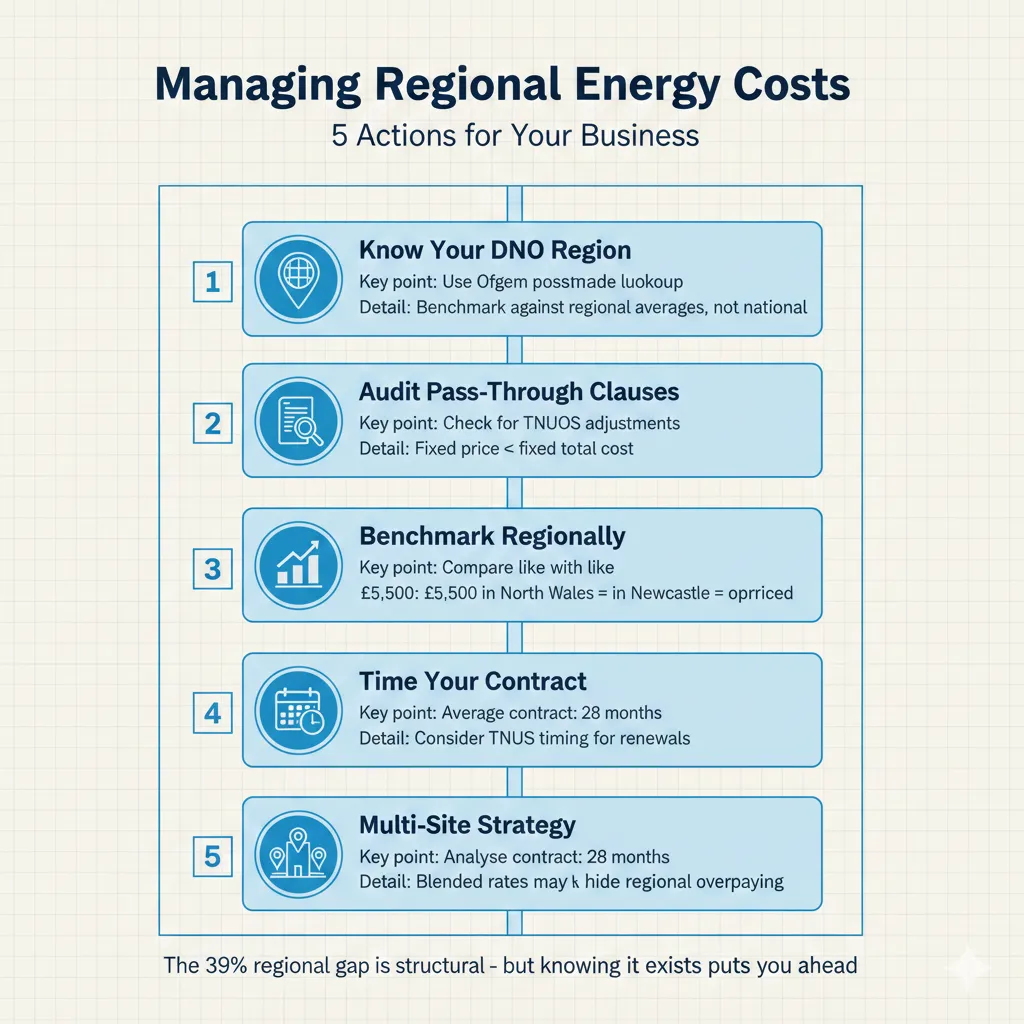
What Can You Actually Do?
Regional charges are largely non-negotiable - they’re regulated costs that suppliers must pass through. But that doesn’t mean you’re helpless.
1. Know Your DNO Region
Check which of the 14 DNO regions your business falls into. Your electricity bill or supplier can confirm this, or you can check by your postcode on your DNO’s website. Understanding which regional charges apply to you helps you:
- Benchmark quotes against regional averages (not national ones)
- Understand why quotes differ between suppliers
- Identify which cost components are negotiable and which aren’t
2. Audit Your Contract for Pass-Through Clauses
“Fixed price” doesn’t always mean “fixed total cost.” Many business energy contracts include pass-through clauses that allow suppliers to increase charges if regulatory costs rise.
Check your contract for language about:
- TNUoS adjustments
- Network charge pass-throughs
- Regulatory cost increases
If your contract has these clauses, your “fixed” rate can still increase when TNUoS charges rise in 2026.
3. Benchmark Against Regional Averages
Don’t compare your North Wales quote to a national average - you’ll always look expensive. Compare it to:
- Other North Wales quotes
- The regional average from POWWR data (£5,746)
- Last year’s regional costs
A quote of £5,500 in North Wales is competitive. The same quote in North East England is overpriced.
4. Consider Contract Timing
POWWR’s data shows the average business energy contract is 28 months - just over two years. This creates strategic considerations:
- Longer contracts lock in current TNUoS levels but also lock in current rates if they fall
- Shorter contracts give more flexibility but expose you to TNUoS increases sooner
- Renewal timing matters - contracts signed before TNUoS increases may lock in lower charges
5. Multi-Site Strategy for Larger Businesses
If you operate across multiple regions, a “blended national rate” may hide the fact that you’re overpaying in some locations. Consider:
- Analysing costs by site and region
- Negotiating region-specific rates where volumes justify it
- Identifying which sites have the most room for improvement
The Bottom Line
Regional pricing isn’t going away. If anything, as renewable generation concentrates in Scotland and the North while demand grows in the South (EVs, heat pumps, data centres), the transmission cost gap will widen.
The businesses that manage this well will:
- Understand which charges are regional and which are negotiable
- Benchmark against appropriate regional comparisons
- Audit contracts for pass-through exposure
- Time renewals strategically as TNUoS changes roll through
The 39% gap between North Wales and North East England isn’t a market inefficiency you can arbitrage away. It’s a structural reality of how UK energy infrastructure works.
But knowing it exists - and understanding why - puts you ahead of most businesses still comparing quotes against national averages and wondering why their Newcastle competitor’s energy costs look so different.
Sources:
- Ofgem - State of the Market Report (Retail), January 2026 (opens in new tab)
- Ofgem - State of the Market Report (Infrastructure), January 2026 (opens in new tab)
- World Kinect - TNUoS Charges Rising in 2026 (opens in new tab)
- Cornwall Insight - Energy Market Predictions 2026 (opens in new tab)
- MHHS Programme - Market-Wide Half Hourly Settlement (opens in new tab)